COVID-19 Vaccination Centre Data Monitor: Accessibility Map Demonstration
Background
With the evolving COVID-19 public health measures and rapid emergence of testing centres, there were several access barriers to obtain information to get tested for COVID-19. In a study conducted on behalf of Statistics Canada, it was reported that approximately 1 in 10 participants were not able to access COVID-19-related testing or medical attention due to their long-term condition or disability (Yang, Dorrance & Aitken, 2020). The Ontario Digital Service (2021) maintains an open data set describing COVID-19 testing centres in the province with basic data on centre amenities, such as location, hours of operation, walk-in availability and accessibility (yes/no response). More detailed data on accessibility in testing centres is needed, which requires direct engagement with the disability community. This highlights the data, policy and design gap in accessing a COVID-19 testing centre.
Map demonstration features
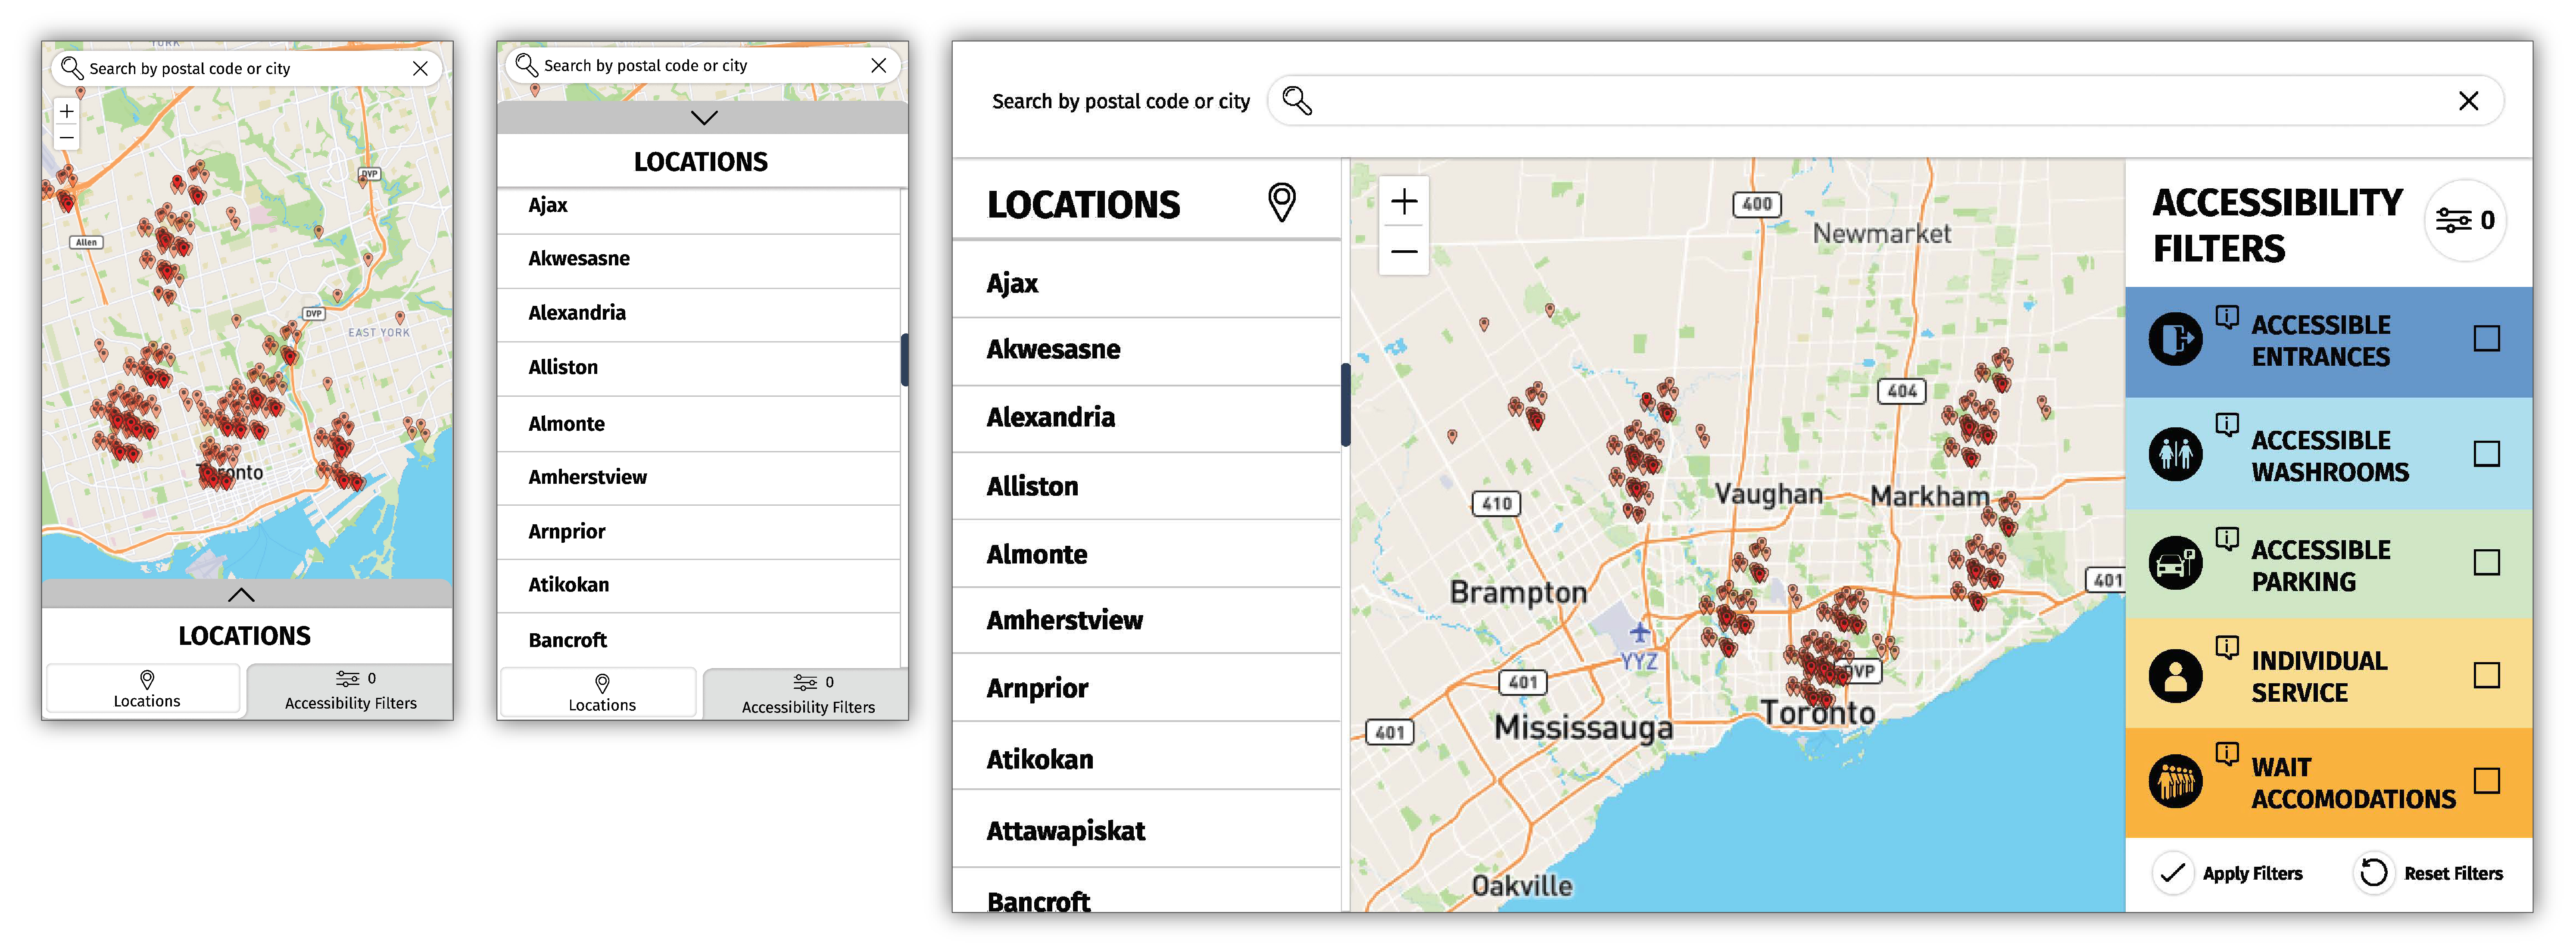
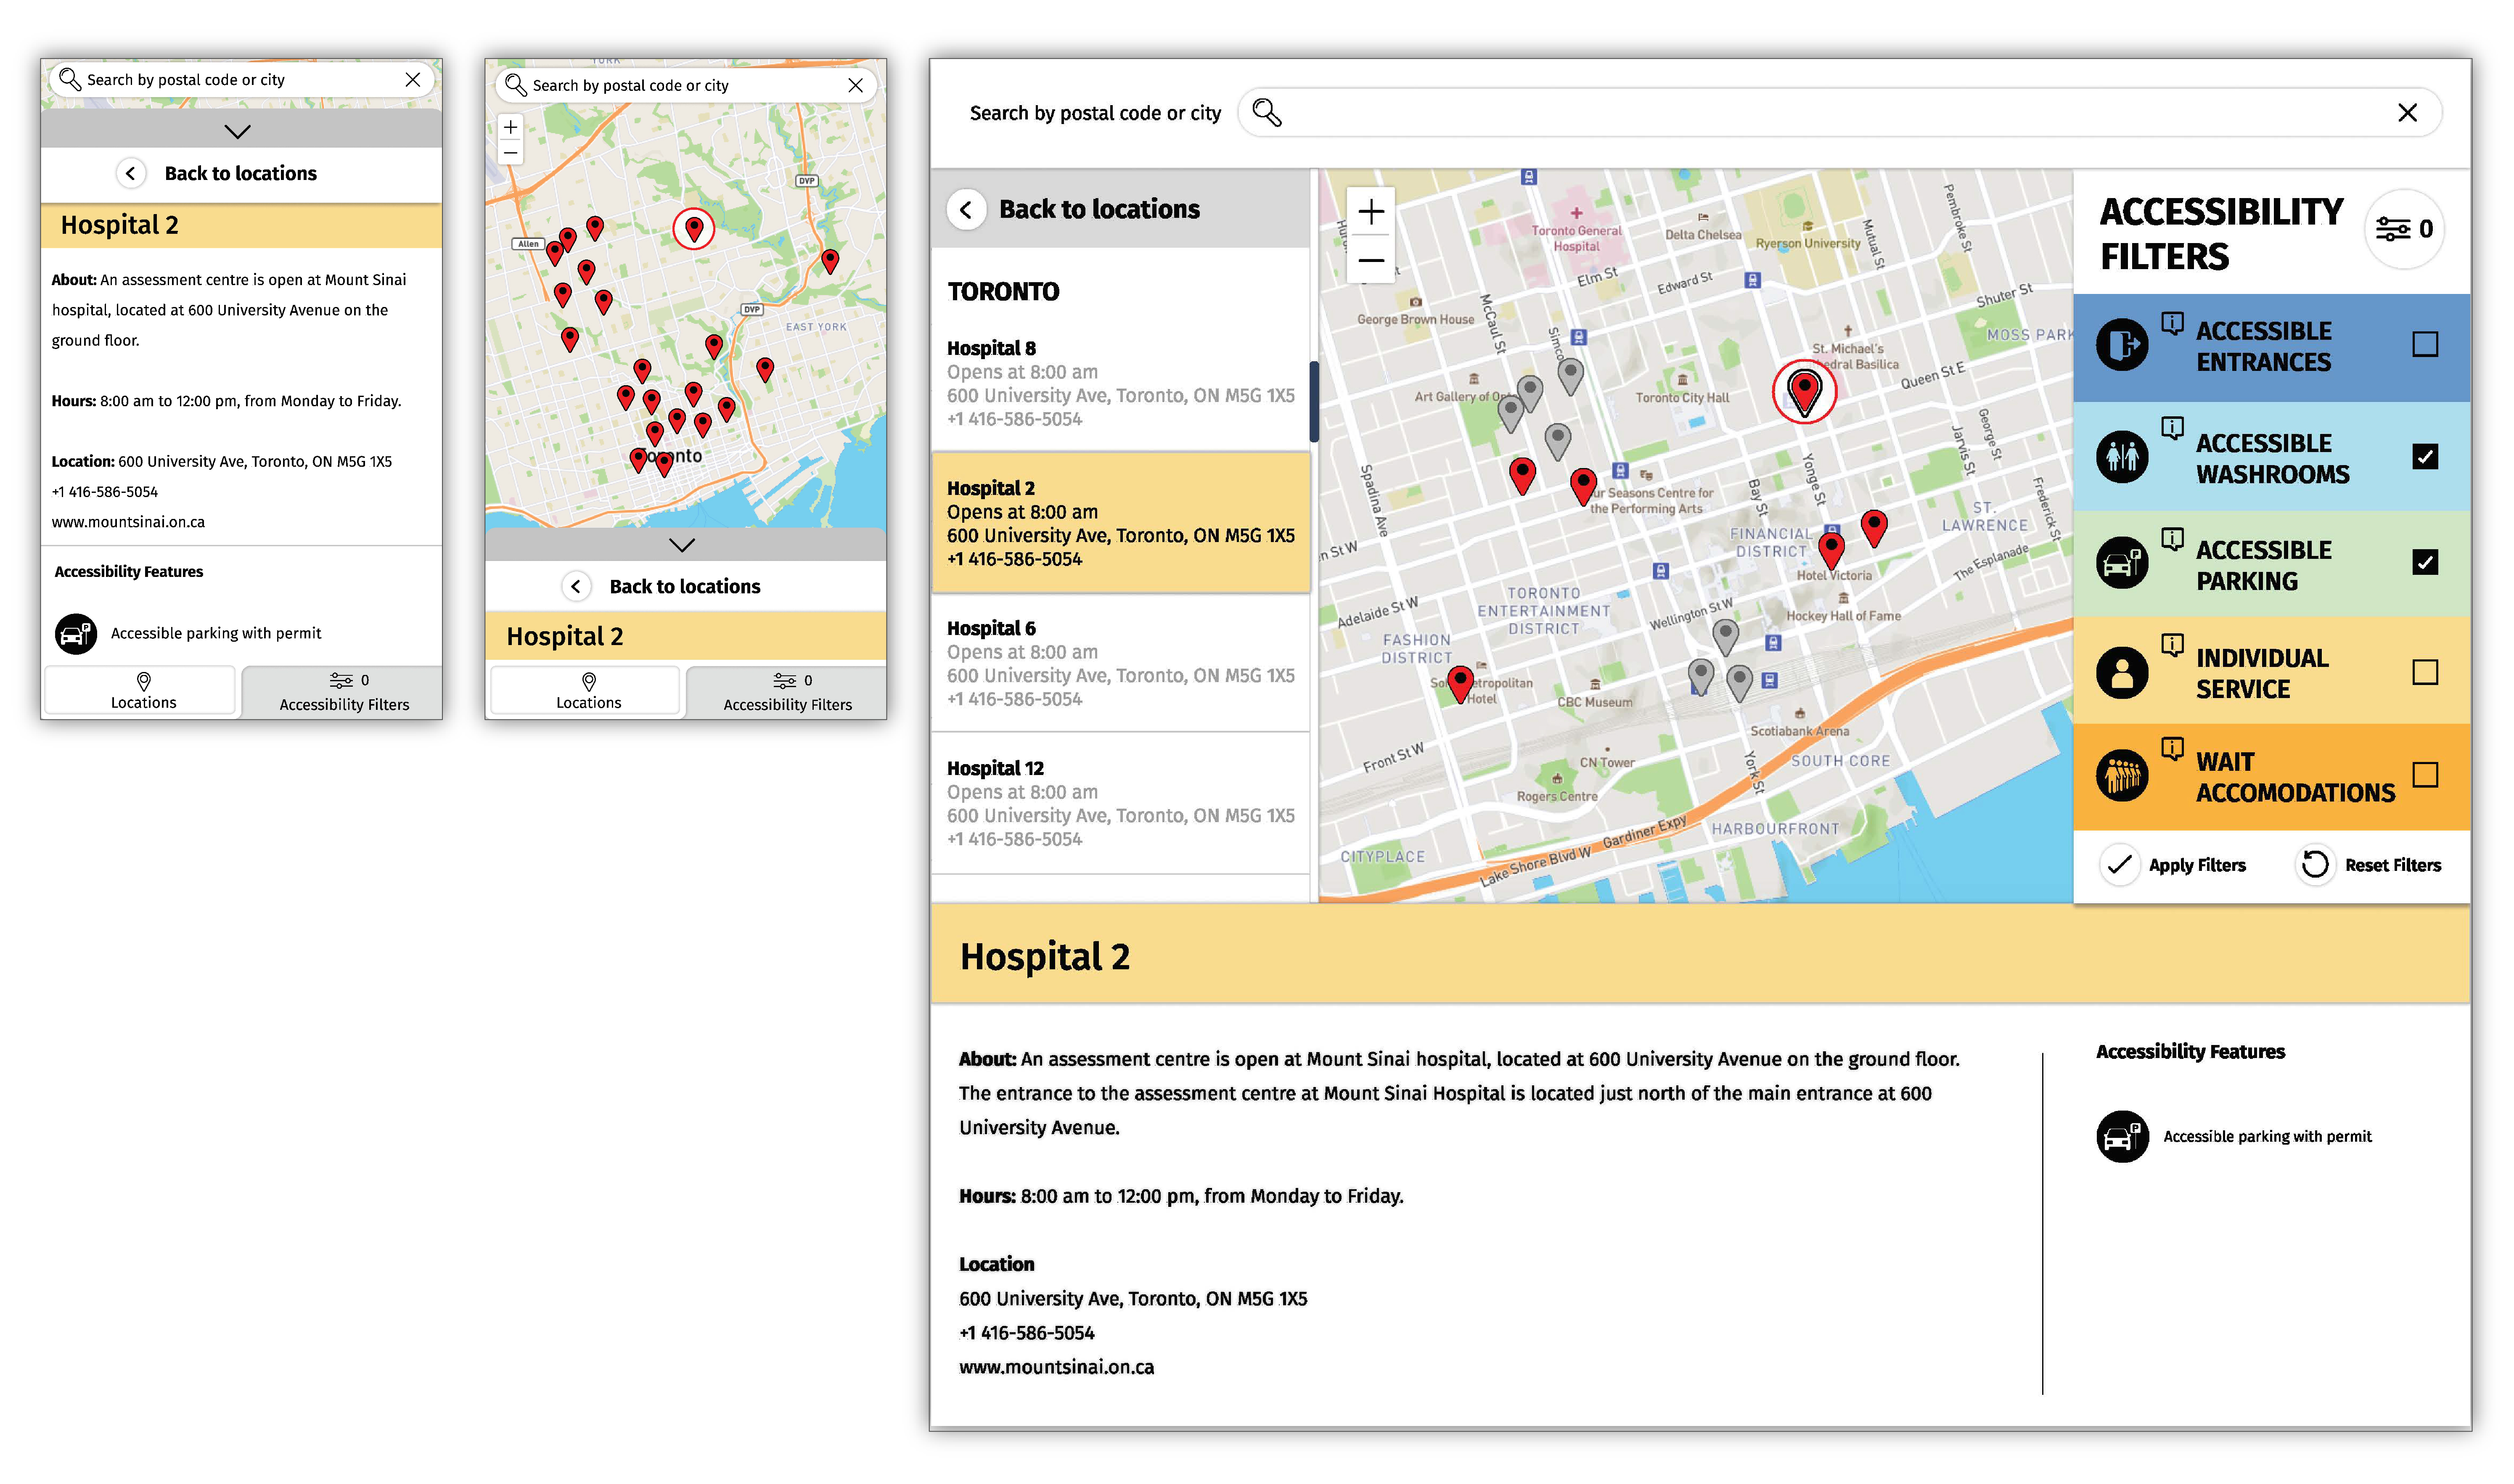
This map demonstration was created to show how these data gaps can be addressed, providing a way to find accessibility information that is not included in these data sets. The map demonstration uses an example data set and demonstrates how data visualization can be designed in an accessible format. Accessibility features in the map include: accessible entrances, accessible washrooms, accessible parking, individual service and wait accommodations. Additional features of the map demonstration are:
- A base map with markers over the testing centres
- Each marker will be clickable and include the following:
- Accessibility features
- Commuting options to the location
- Contact information
- Street view/photos linking to Google Maps
- Comments and insights
Map demonstration
You can access the prototype map visualization at
https://wecount.inclusivedesign.ca/map/
Note that the whilst the locations of the testing centres are sourced from real data, their accessibility status is synthesized by a random algorithm for the purposes of this visualization.
Pluralistic data infrastructure
As well driving development of components of an accessible map-based visualisation, this prototype is also driving the developments of a pluralistic data infrastructure allowing communities to take control of their data and its relationships. The data sources (in this case, one real data source at the Ontario Data Service, and a synthetic internal one) are configured in an open, declarative pipeline which regularly fetches the upstream data, weaves it together whilst maintaining its provenance, and then automatically retriggers the pipeline of republishing the visualization.
The aim is to put tools in the hands of communities for publishing their own data and visualizations derived from it, and for maintaining its relationships with data managed by other communities.
Design of map-based visualization
Workflow for COVID-19 map interface
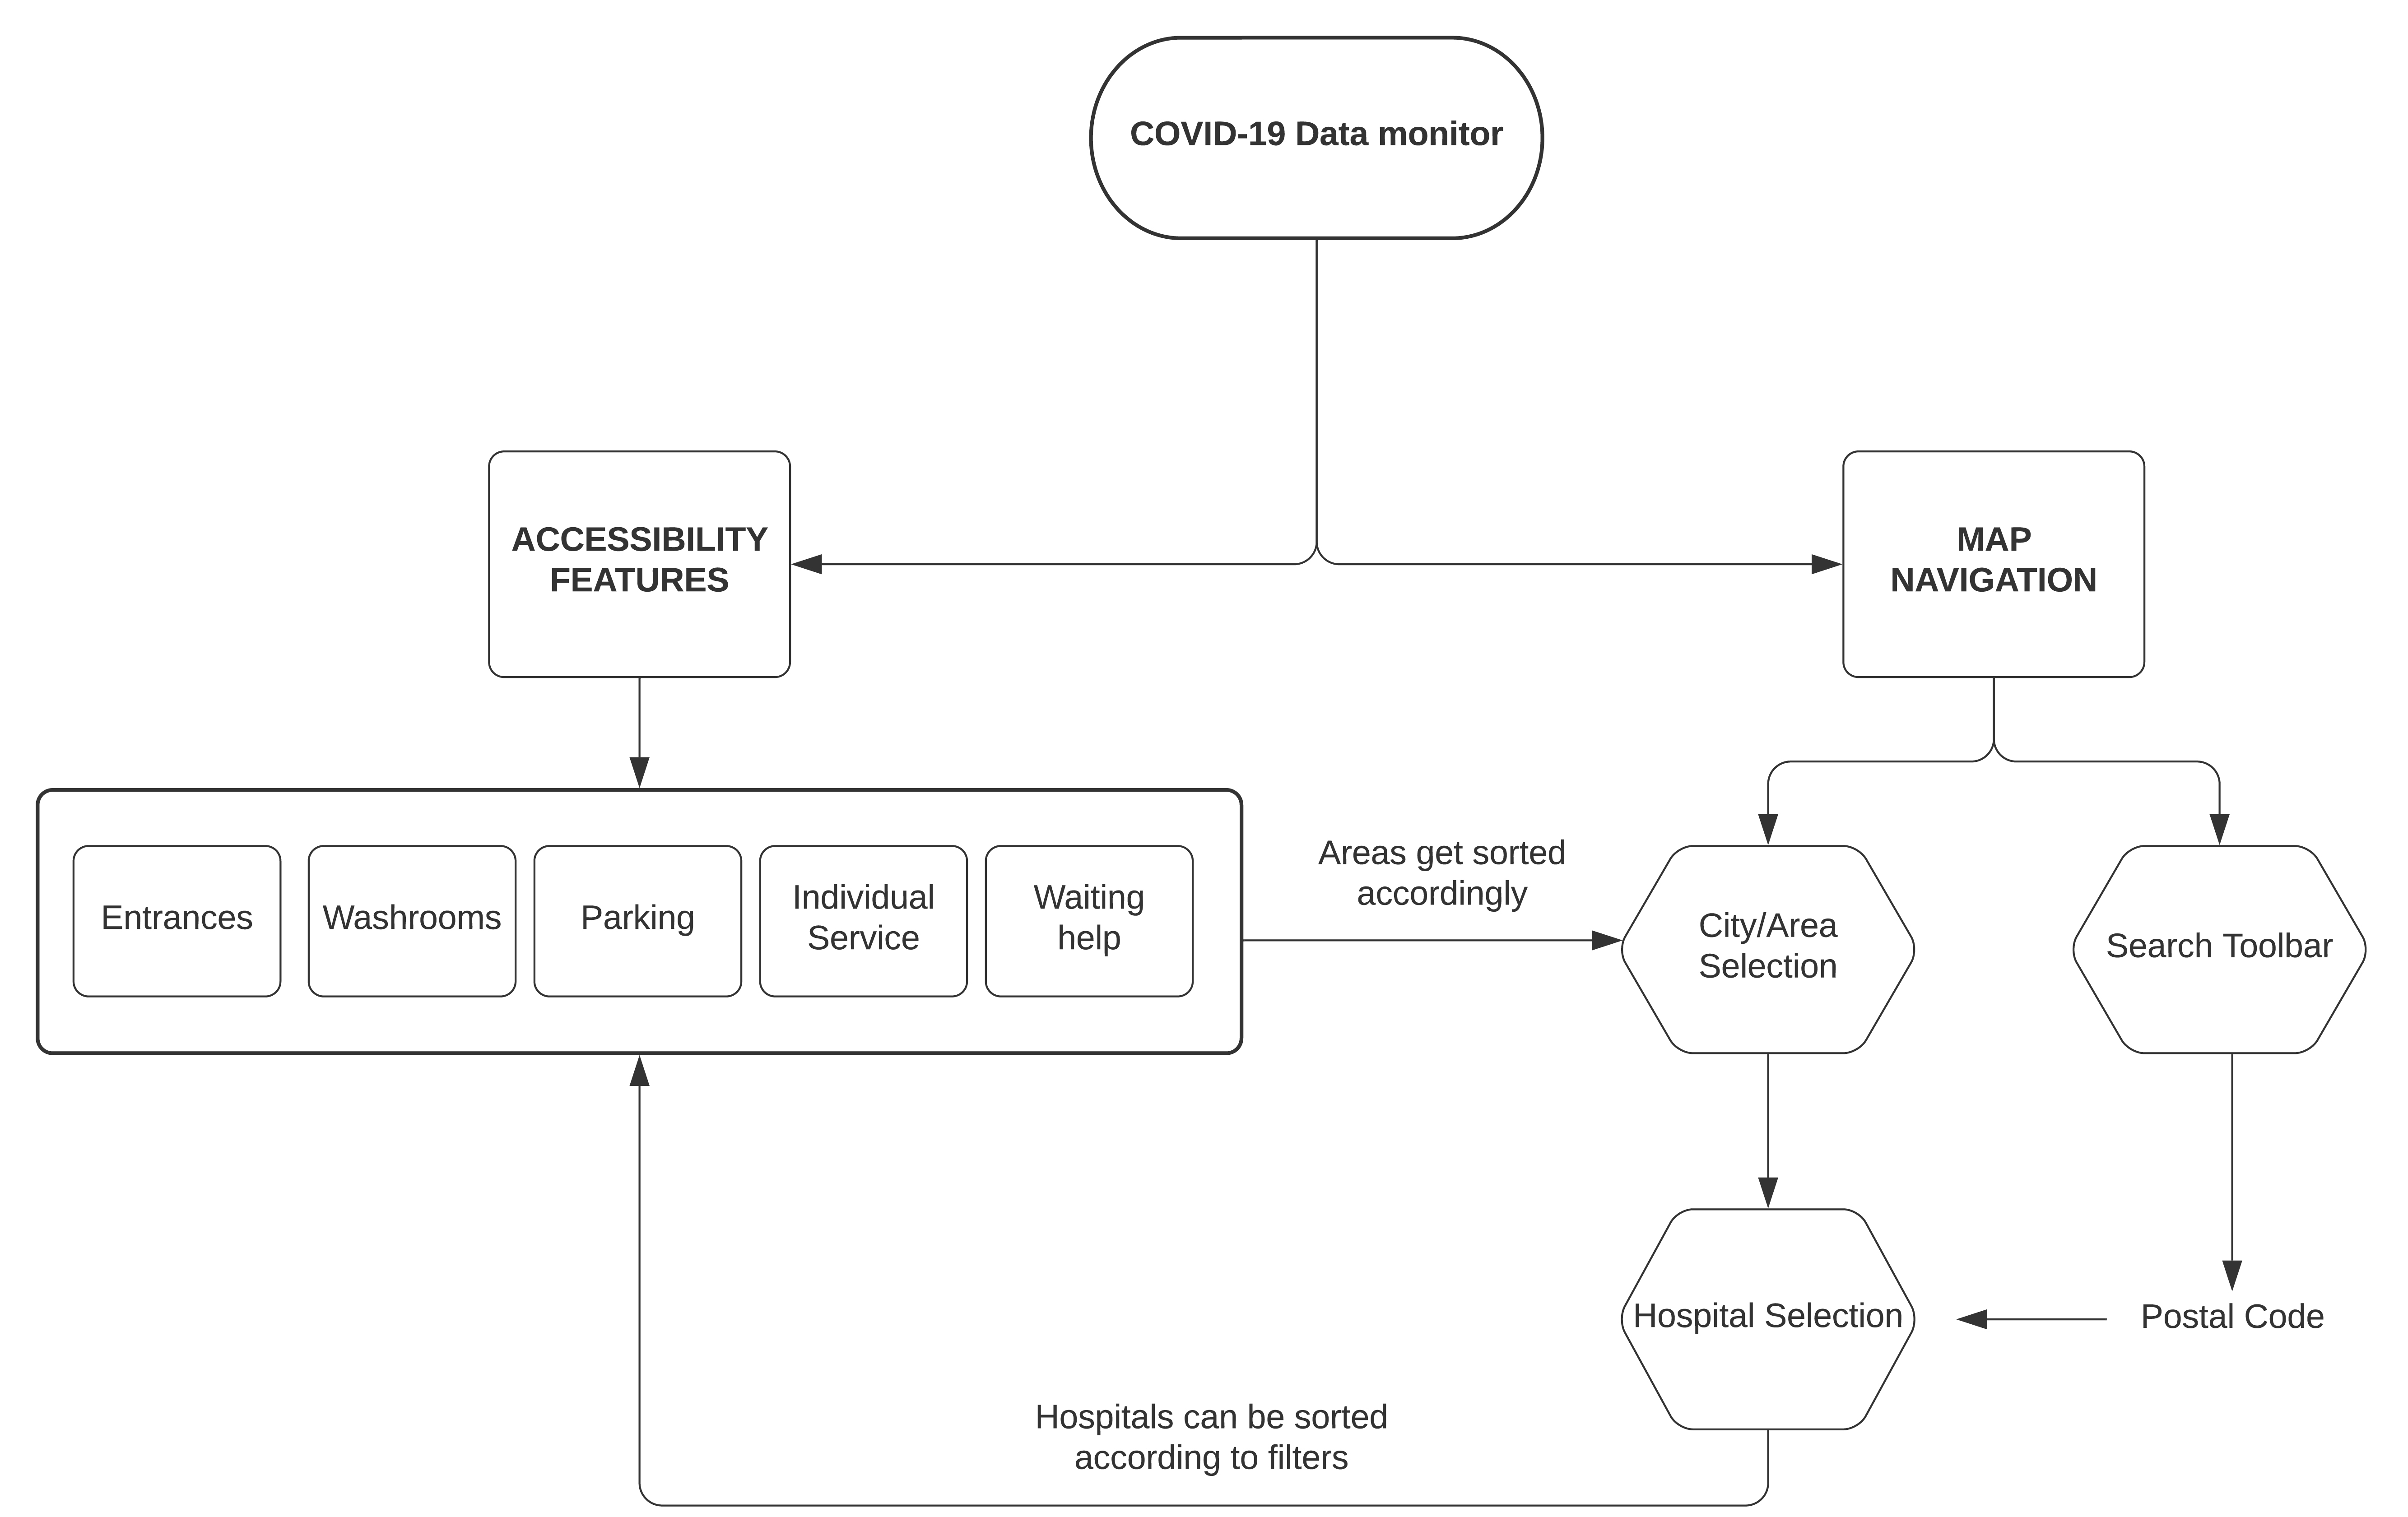
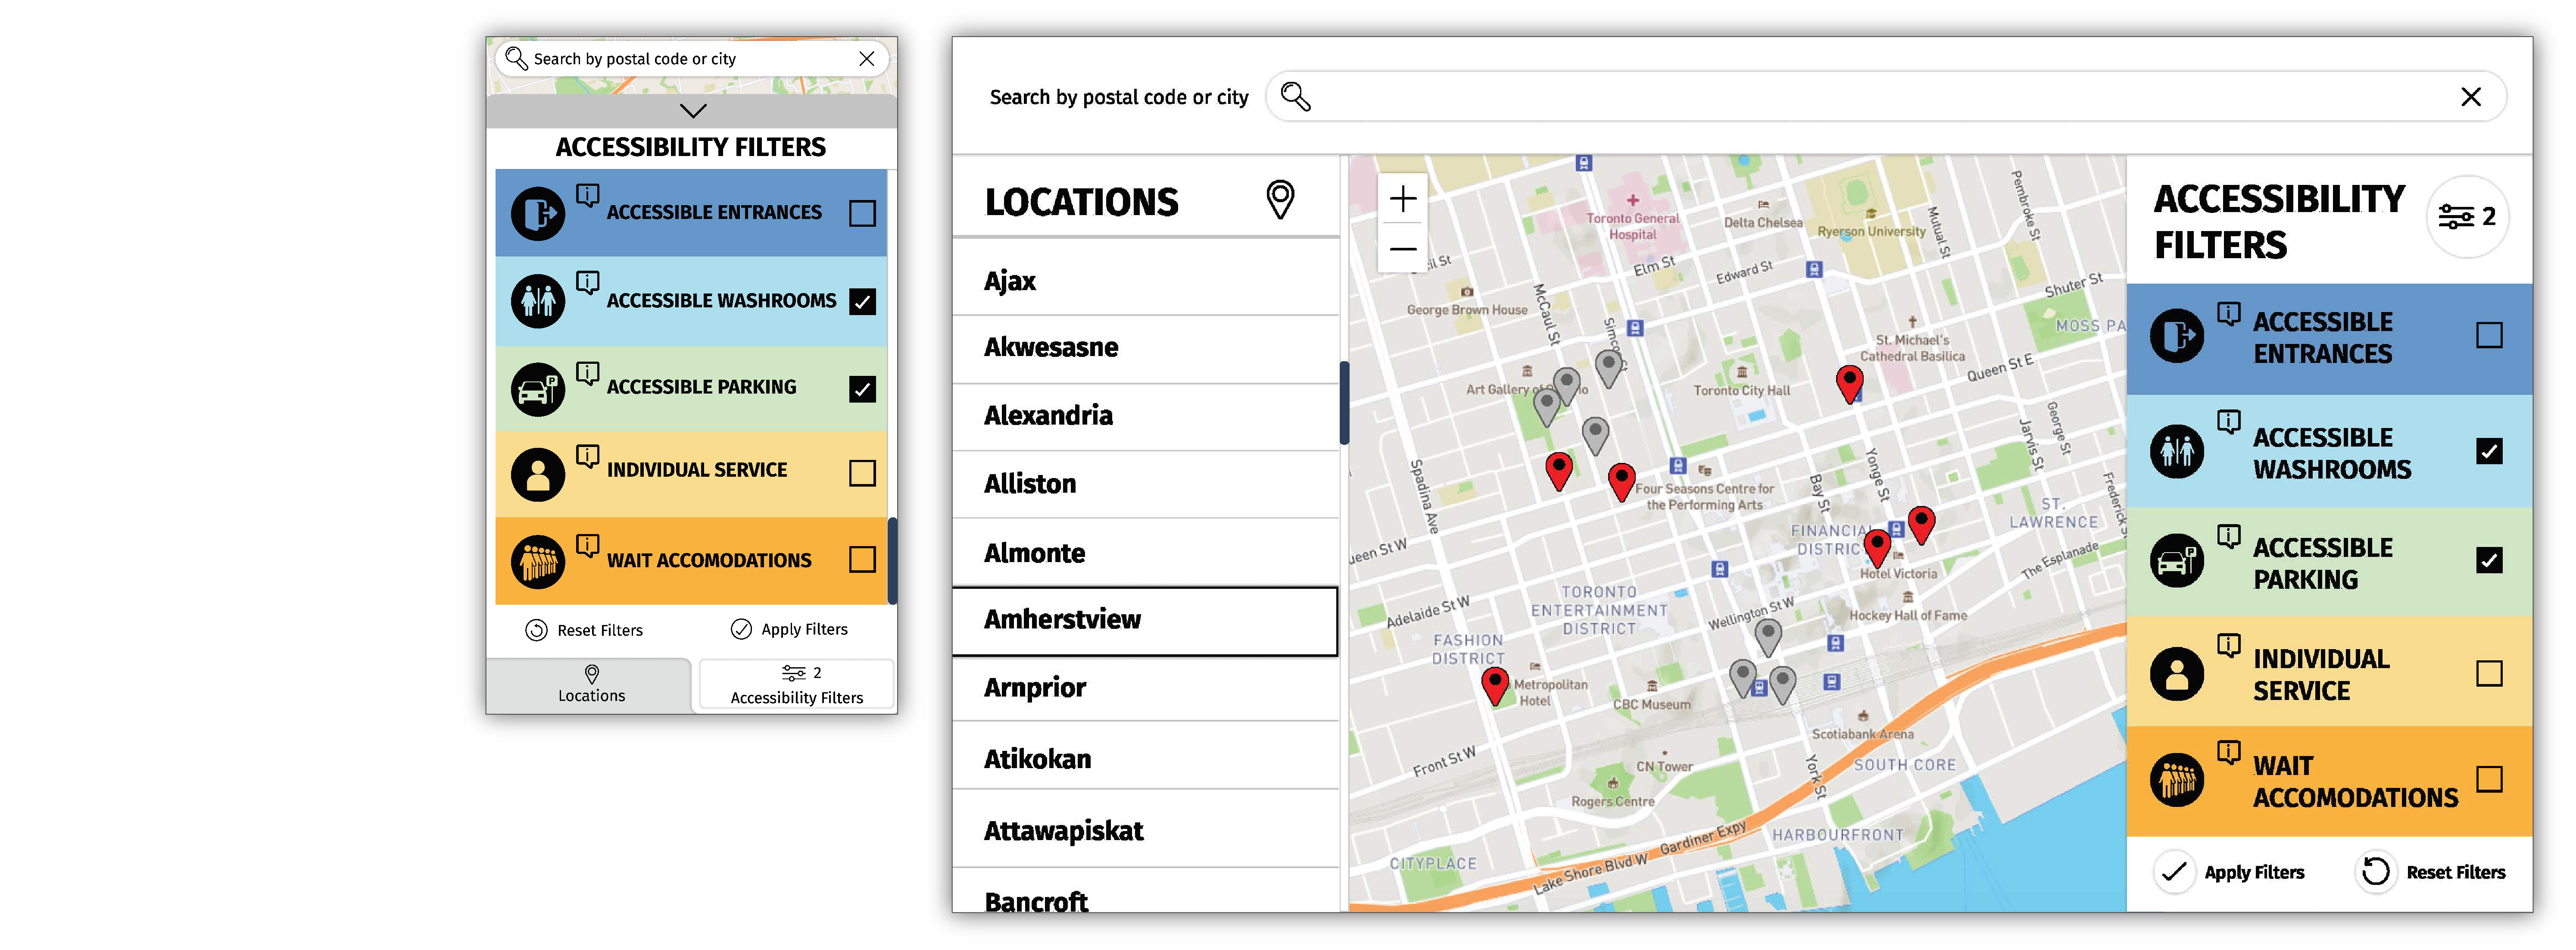
The following images show that data can be presented visually through placement on the map and use of colour as well as in text formats that can be read or accessed by assistive technology. The presentation of information is flexible without compromising the design of the map and allows the individual to choose how to engage with the information.
Landing page
Accessibility features
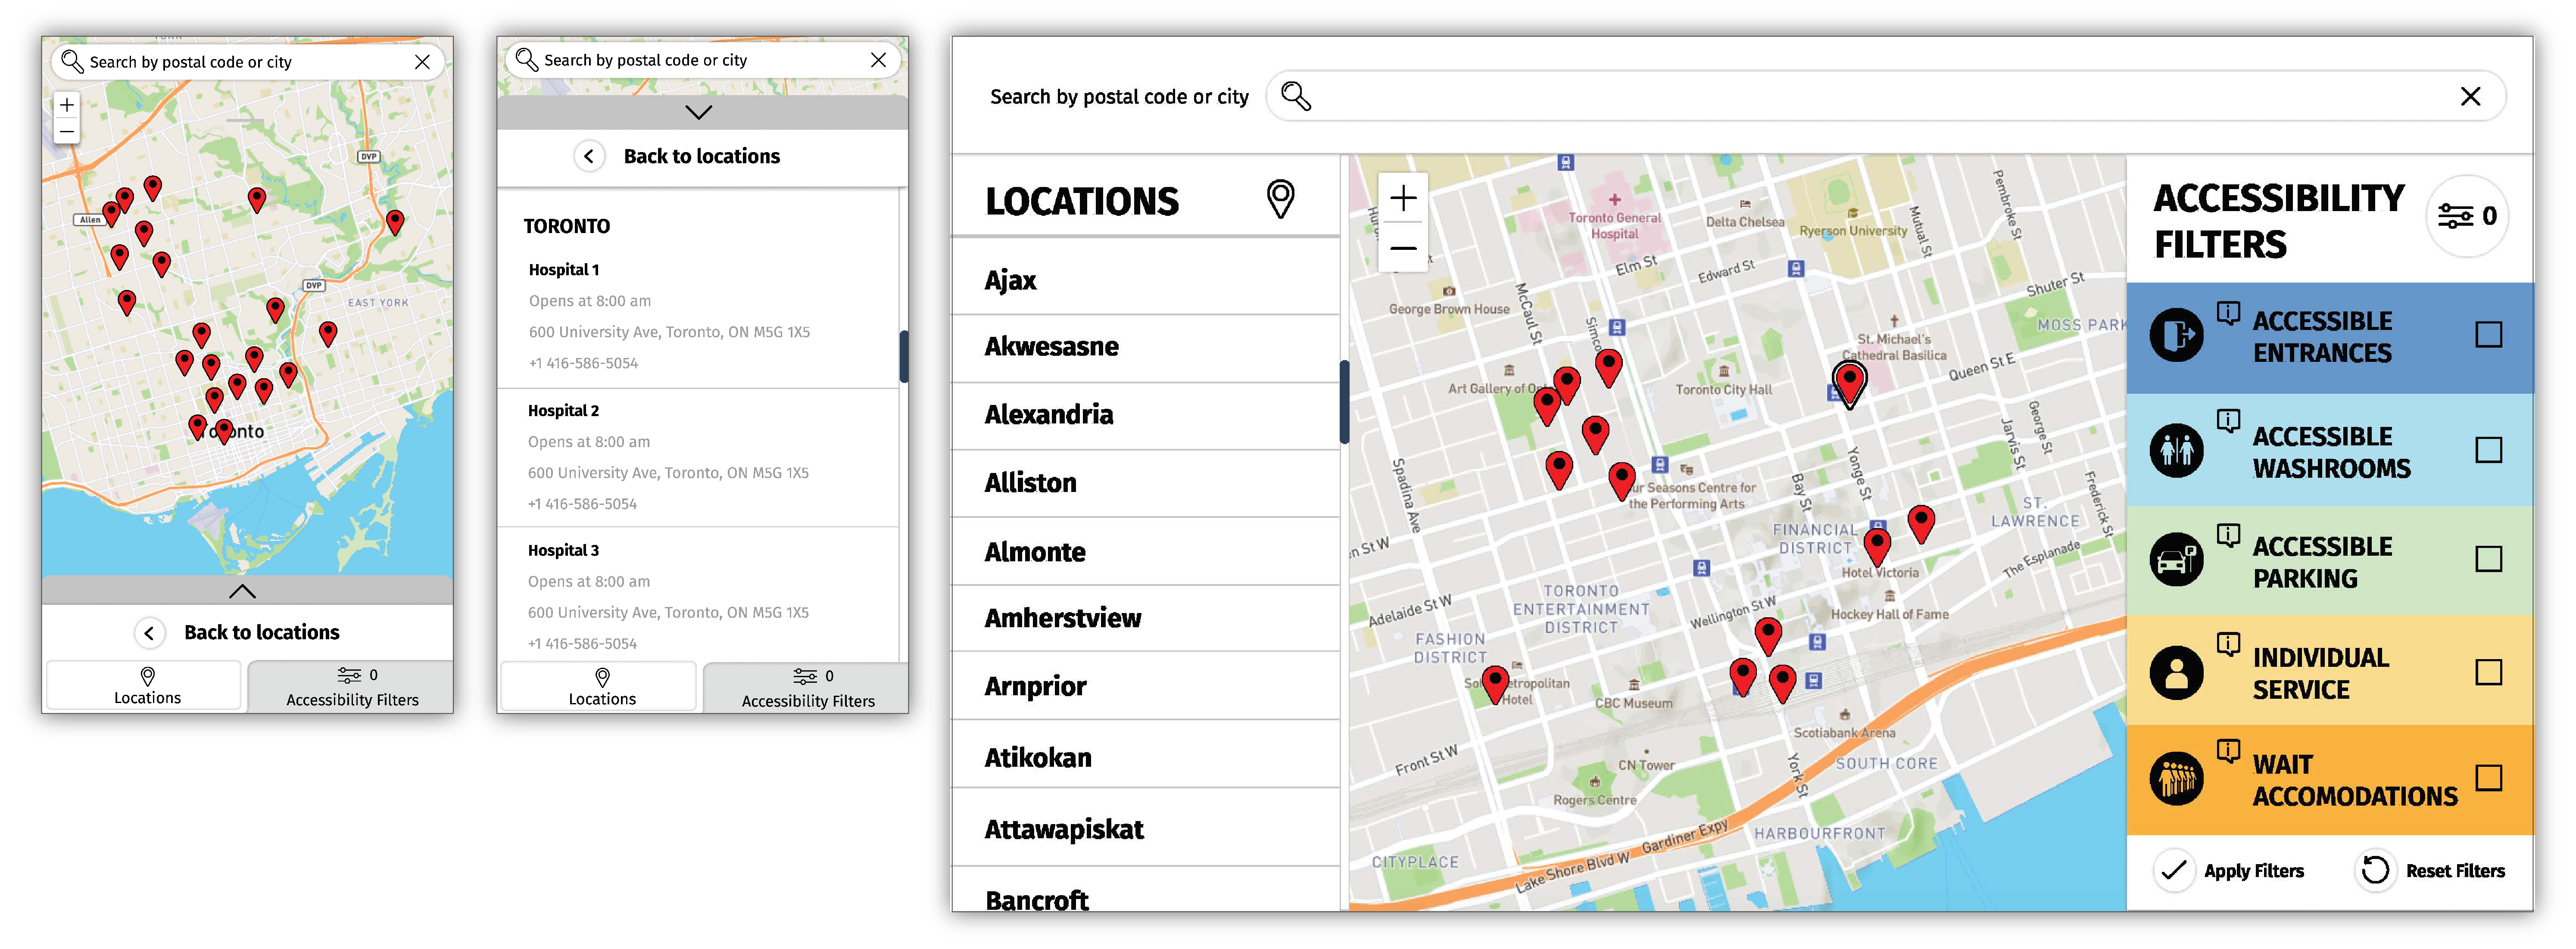
City navigation
Centre details and contact information
Contributors
- Antranig Basman – Senior Technical Architect
- Cindy Qi Li – Senior Inclusive Developer
- Uttara Ghodke – Inclusive Designer
- Lisa Liskovoi – Inclusive Designer
- Michelle D’Souza – Senior Inclusive Developer
- Dana Ayotte – Senior Inclusive Designer
- David Pereyra – Project & Outreach Coordinator
- Vera Roberts – Senior Research Manager
- Celine Nguyen – Research Assistant
- Jutta Treviranus – Director
References
Ontario Digital Service. (2021). COVID-19 assessment centre locations [Data set]. Treasury Board Secretariat. https://data.ontario.ca/en/dataset/covid-19-assessment-centre-locations
Yang, F.-J., Dorrance, K., & Aitken, N. (2020). The changes in health and well-being of Canadians with long-term conditions or disabilities since the start of the COVID-19 pandemic. Statistics Canada. https://www150.statcan.gc.ca/n1/pub/45-28-0001/2020001/article/00082-eng.htm